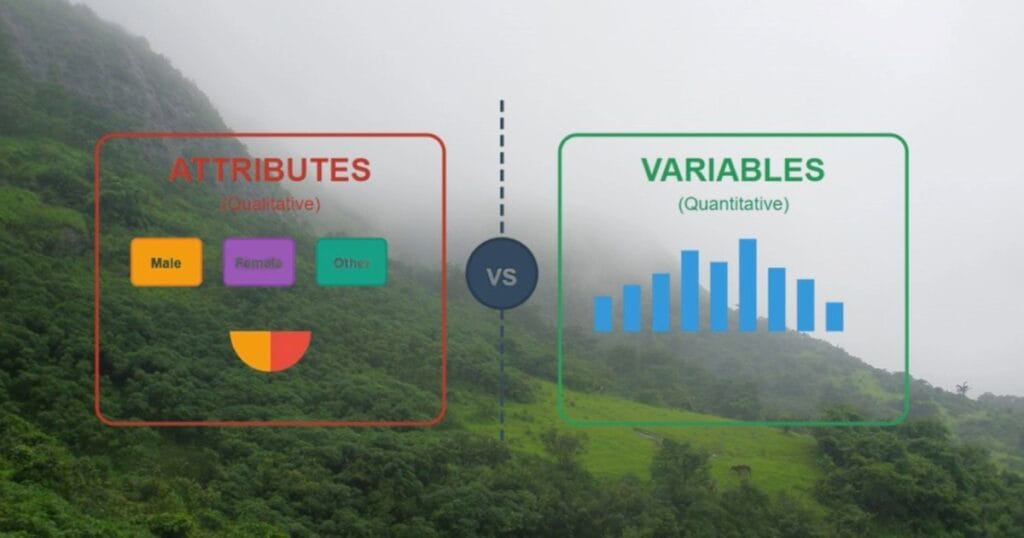
Environmental Statistical Approaches for Attributes and Variables provide the analytical tools needed to collect, summarise, interpret, and compare environmental data with confidence. Whether analysing qualitative attributes or quantitative variables, statistical methods help researchers identify patterns, test hypotheses, and draw meaningful conclusions from environmental observations. A sound understanding of these approaches is essential for environmental research, data analysis, and success in UGC-NET/JRF, SLET, ARS, GATE, and other competitive examinations.
Use these curated MCQs to assess your conceptual understanding, identify knowledge gaps, and strengthen your preparation for competitive examinations.
Syllabus Outline
- Classification of data into attributes and variables.
- Attributes (qualitative data): nominal and ordinal attributes.
- Variables (quantitative data): discrete and continuous variables.
Quick Study Guide
In environmental science, monitoring datasets can be massive and messy. To make sense of air quality indices, species counts, or pollutant concentrations, we must first classify data into two main statistical categories: Attributes and Variables.
A. Qualitative vs. Quantitative
1. Attributes (Qualitative Data): Attributes describe a qualitative characteristic or property that cannot be directly measured on a continuous numerical scale. They are classified into two subtypes:
- Nominal Attributes: Distinct categories with no inherent mathematical ranking or order, for example: Species names in biodiversity surveys, soil types, or weather conditions recorded as “Sunny”, “Cloudy”, or “Rainy”.
- Ordinal Attributes: Categories that follow a clear, meaningful ranking or logical order, but the exact mathematical distance between the ranks is not equal or measurable. Examples: Air quality ratings categorised as “Good”, “Moderate”, “Unhealthy”, or grouped noise brackets like “Below 40 dB” and “40–60 dB”.
2. Variables (Quantitative Data): Variables are measurable, numerical characteristics for which mathematical operations (such as addition or averaging) are valid. They are split into:
- Discrete Variables: Numerical values obtained by counting whole numbers. They cannot have fractional components. Example: The count of individual birds observed in a habitat or the number of trees in a sample plot.
- Continuous Variables: Numerical measurements obtained along a continuous scale where any fractional or decimal value is possible. Examples: Dissolved oxygen concentration in water bodies (measured in mg/L), ambient temperature, or heavy metal concentrations.
B. The Statistical Analysis Workflow
- Identify the Broad Data Class: Qualitative vs. Quantitative.
- Determine the Data Scale: Nominal, Ordinal, Interval, or Ratio. Map the data to its proper scale to figure out what mathematical operations are allowed (e.g., nominal categories cannot be averaged, but ratio variables can).
- Assess Core Distribution Metrics: Mean, SD, and Variance. Compute the central tendency and spread of your variables. Choose robust measures such as the median if the dataset contains severe pollution outliers.
C. Concept and Calculations
- Standard Deviation: Measures the absolute spread or variability of individual measurements around the sample mean.
- Standard Error: Measures the precision and consistency of the sample mean relative to the true population mean.
- Confidence Intervals: Defines the range within which the true population parameter is expected to fall at a given level of significance. It uses the sample mean, the standard error, and a critical value (t or z) derived from a distribution table.
- Coefficient of Variation: A relative measure of dispersion expressed as a percentage. It is incredibly useful in environmental impact assessments because it lets you compare the variability of two completely different datasets, even if they have different means or units. It is calculated by dividing the standard deviation by the mean and multiplying by 100 to express it as a percentage.
D. Advanced Environmental Data
- Heterogeneous (Mixed-Type) Data Analysis: Emerging fields such as environmental genomics and citizen science track mixed structures. For example, a mobile app might record a participant’s location and binary nominal attributes (such as the simple presence or absence of an invasive species). Analysing this requires specialised spatial-categorical statistical models.
- Ecosystem Tipping Points: Statistical modelling often requires understanding how continuous environmental drivers (e.g. a steady, gradual rise in water temperature) can trigger sudden, discrete state changes in an entire ecosystem (such as the rapid collapse or bleaching of a coral reef).
Test Your Knowledge
This quiz contains 25 concept-based MCQs on “Environmental Statistical Approaches for Attributes and Variables“. Each question has a single correct/most appropriate answer.
*****
1. The measurement of dissolved oxygen concentration in water bodies (measured in mg/L) is an example of:
A) Discrete variable
B) Continuous variable
C) Nominal variable
D) Ordinal variable
2. Air quality ratings categorised as “Good”, “Moderate”, “Unhealthy”, “Very Unhealthy” represent:
A) Nominal attribute
B) Ordinal attribute
C) Discrete quantitative variable
D) Continuous quantitative variable
3. The variable “species name” in biodiversity studies is classified as:
A) Ordinal variable
B) Interval variable
C) Nominal variable
D) Ratio variable
4. The count of bird species observed in different habitats is an example of:
A) Continuous variable
B) Nominal attribute
C) Discrete variable
D) Ordinal attribute
5. The classification of water bodies as “River”, “Lake”, “Pond”, “Stream” represents which type of attribute?
A) Quantitative discrete
B) Quantitative continuous
C) Qualitative nominal
D) Qualitative ordinal
6. In environmental monitoring, if noise levels are recorded as “Below 40 dB”, “40-60 dB”, “60-80 dB”, “Above 80 dB”, this represents:
A) Continuous quantitative data that has been grouped
B) Naturally discrete quantitative data
C) Nominal qualitative attribute
D) True ordinal measurement scale
7. In ecological research, the Shannon diversity index can theoretically range from 0 to positive infinity. This makes it:
A) A discrete quantitative variable
B) A continuous quantitative variable
C) An ordinal qualitative attribute
D) A nominal qualitative attribute
8. The variable “habitat quality” assessed using scores 1, 2, 3, 4, 5 (where 1=Poor, 5=Excellent) is:
A) Continuous because it uses numbers
B) Discrete because it takes specific values
C) Ordinal because it represents ranked categories
D) Nominal because categories are arbitrarily assigned
9. Which statement correctly distinguishes between attributes and variables in statistics?
A) Attributes are always numerical; variables are always categorical
B) Variables represent measurable characteristics, and attributes represent qualitative properties
C) Attributes and variables are identical terms in statistics
D) Variables are only used for experimental data, attributes for observational data
10. In environmental impact assessment, when projects are classified by impact type as “Physical”, “Chemical”, “Biological”, “Social”, this classification is:
A) Ordinal because impacts can be ranked by severity
B) Continuous because impacts vary in magnitude
C) Nominal because categories are distinct without a natural order
D) Discrete because there are countable categories
11. The count of pollution violations recorded per industrial facility per year represents:
A) Continuous quantitative variable
B) Discrete quantitative variable
C) Ordinal qualitative variable
D) Nominal qualitative variable
12. The variable “weather condition” recorded as “Sunny”, “Cloudy”, “Rainy”, “Stormy” during environmental monitoring is:
A) Ordinal because weather severity increases
B) Continuous because the weather varies gradually
C) Nominal because categories are distinct without inherent order
D) Discrete because weather types are countable
13. When environmental monitoring produces “non-detect” values below instrument detection limits, the appropriate statistical treatment recognises this as:
A) Missing data to be ignored
B) Zero values for analysis
C) Left-censored continuous data
D) Ordinal categories below the threshold
14. The biodiversity measure “effective number of species” calculated from the Shannon index represents:
A) Discrete variable because species are counted
B) Continuous variable despite integer interpretation
C) Ordinal variable ranking diversity levels
D) Nominal variable categorising community types
15. In environmental justice studies, when socioeconomic status is measured using composite indices (0-100 scale), but only reported in quintiles (1st, 2nd, 3rd, 4th, 5th), the working variable becomes:
A) Continuous quantitative
B) Discrete quantitative
C) Ordinal qualitative
D) Nominal qualitative
16. The measurement of environmental noise using the logarithmic decibel scale creates a mathematical relationship where:
A) Equal intervals represent equal acoustic energy differences
B) The variable remains continuous but with non-linear properties
C) The scale converts continuous sound energy into discrete categories
D) Ordinal rankings replace continuous measurements
17. When environmental variables are standardised using z-scores for comparison across different units, the transformed variables:
A) Become discreet due to standardisation
B) Remain continuous with altered scale properties
C) Convert to ordinal rankings
D) Transform into nominal categories
18. In environmental modelling, when continuous predictor variables are discretised into bins for non-parametric analysis, the statistical implications include:
A) No loss of information occurs
B) Increased statistical power in all cases
C) Potential loss of information about within-bin variation
D) Conversion to truly ordinal measurements
19. The environmental concept of “carrying capacity”, when measured as maximum sustainable population size, represents:
A) Discrete variable because populations are counted
B) Continuous variable because capacity varies continuously
C) Ordinal variable ranking sustainability levels
D) Nominal variable categorising ecosystem types
20. The environmental measurement “species evenness” calculated using Pielou’s evenness index produces values between 0 and 1, representing:
A) Discrete proportional categories
B) Continuous, bounded quantitative variable
C) Ordinal evenness rankings
D) Nominal diversity classifications
21. Contemporary environmental monitoring using Internet of Things (IoT) sensors generates high-frequency continuous data streams. When these measurements are transmitted as discrete digital signals, the statistical consideration for analysis is:
A) Digital transmission changes the variable type to discrete
B) The underlying continuous nature is preserved despite digital encoding
C) Data becomes ordinal due to signal quantisation
D) Nominal coding replaces quantitative measurement
22. Recent research in environmental genomics analyses gene expression levels (continuous) alongside species presence/absence data (binary nominal). This mixed-type analysis requires:
A) Converting all variables to the same measurement type
B) Specialised statistical methods for heterogeneous data types
C) Separate analysis of each variable type
D) Transformation of nominal to continuous variables
23. Current studies on urban environmental justice use machine learning to analyse relationships between continuous pollution exposure variables and categorical demographic attributes. The analytical challenge involves:
A) All variables must be continuous for machine learning
B) Categorical variables cannot be used as predictors
C) Mixed variable types require appropriate algorithm selection
D) Demographic variables must be converted to continuous scales
24. Modern environmental citizen science projects collect data where participants report observations using mobile apps with standardised categorical responses alongside GPS coordinates (continuous). This mixed data structure requires:
A) Ignoring categorical responses for spatial analysis
B) Converting GPS coordinates to categorical regions
C) Integrated analysis methods for mixed spatial-categorical data
D) Separate analysis of categorical and continuous components
25. Emerging research on environmental tipping points examines how continuous environmental drivers lead to discrete state changes in ecosystems. This phenomenon represents:
A) Measurement error in continuous variables
B) Fundamental discrete nature of all environmental processes
C) Threshold effects, where continuous inputs produce categorical outcomes
D) Impossibility of continuous environmental measurements
*****
Previous: Environmental Governance by International Institutions: IPCC, UNEP, and IGBP
Next: Measurement of Central Tendency and Dispersion
References
- Gupta, S.P. (2021). Statistical Methods, Sultan Chand & Sons, 46th Edition.
- Barnett, V. (2004). Environmental Statistics: Methods and Applications, John Wiley & Sons, 1st Edition.
- Manly, B.F.J. (2008). Statistics for Environmental Science and Management, Chapman and Hall/CRC, 2nd Edition.
🔗 Explore More MCQs: